STR Weekly Insights: 21-27 July 2024
 STR Weekly Insights: 21-27 July 2024
|
 STR Weekly Insights: 21-27 July 2024
|
 STR Weekly Insights: 21-27 July 2024
|
 STR Weekly Insights: 21-27 July 2024
|
 STR Weekly Insights: 21-27 July 2024
|
 STR Weekly Insights: 21-27 July 2024
|
 STR Weekly Insights: 21-27 July 2024
|
 STR Weekly Insights: 21-27 July 2024
|

Countries/markets mentioned:
- United States: Atlanta, Chicago, Denver, Detroit, Las Vegas, Los Angeles, Miami, Minneapolis, New Orleans, Philadelphia, San Diego and San Francisco
- Global: France (Île-de-France, Paris), United Kingdom (London)
Highlights
- Olympic impact for Paris hotels following patterns similar to London in 2012
- U.S. week-to-week occupancy decline greater than past years
- Sunday and Monday were still lifted by tech outage
- Healthy group demand in the U.S.
The industry reached the season turning point of the summer with U.S. occupancy falling after the previous week’s annual peak. While this seasonal decline was expected, it was greater than the decrease seen last year and in 2019. The previous week’s tech outage lifted performance for the first two days of the week, however, each day following slowed up to the largest decline on Saturday. This pattern occurred across all chain scales and was particularly evident in the Top 25 Markets, specifically—Atlanta, Chicago, Denver, Detroit and Minneapolis. Not surprising, airport hotels, housing travelers impacted by cancelled flights due to the outage, also benefitted. The bright spot of the week continued to be strong group performance, which showed increased demand and rate across both the Top 25 Markets and the rest of the country.
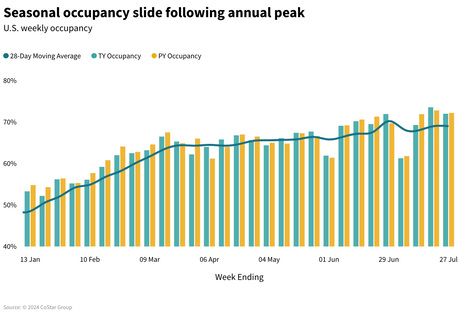
Softer performance following summer’s peak
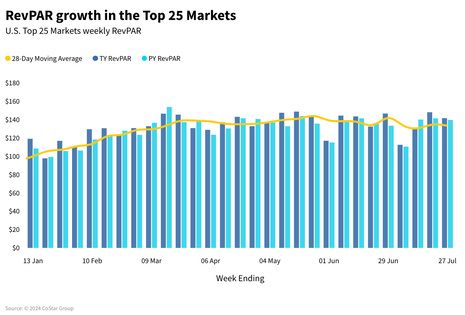
U.S. occupancy decreased 1.5 percentage points (ppts) from the peak achieved the prior week. This decline was greater than the week-over-week (WoW) decline seen last year (-0.6ppts) and in 2019 (-0.4ppts). Average daily rate (ADR) decreased 0.9% WoW, resulting in revenue per available room (RevPAR) down 3.0%. Compared to last year, ADR remained up 1.3%, resulting in a RevPAR gain of 0.9%. The Top 25 Markets continued to produce stronger metrics compared to the rest of the country with RevPAR up 1.4% YoY, which was the result of growth in both ADR (+1.1%) and occupancy (+ 0.3ppts). RevPAR for the rest of the country increased just 0.5% YoY.
|
STR Weekly Insights: 21-27 July 2024
|
Final days of the tech outage impact
Early in the week, certain industry appeared to benefit from the spillover demand caused by the previous Friday’s tech outage with Sunday posting the largest RevPAR increase (+2.6%) followed by Monday (+2.2%). Each subsequent day produced weaker RevPAR ending with Saturday down 1.5%. Airport hotels benefited the most with the YoY RevPAR progression from +9.9% on Sunday to +7.9% on Monday and then steadily declining through to Saturday (-4.9%). The five markets mentioned above recorded double-digit RevPAR growth on Sunday and all but Minneapolis continued double-digit RevPAR gains on Tuesday.
|
STR Weekly Insights: 21-27 July 2024
|
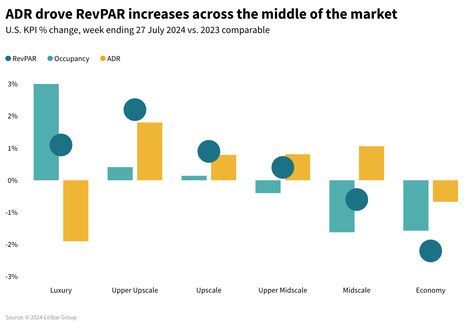
Upper Upscale strongest for the past four weeks
Bifurcation across the chain scales continued with RevPAR increasing for Upper Upscale (+2.2%) and Luxury (+1.1%). The next four chain scales steadily declined from -0.9% for Upscale to -2.2% for Economy. ADR performance was stronger than occupancy across all chain scales except Luxury, which was lifted by occupancy. All chain scales experienced positive YoY RevPAR comparisons on Sunday and Monday, except Economy.
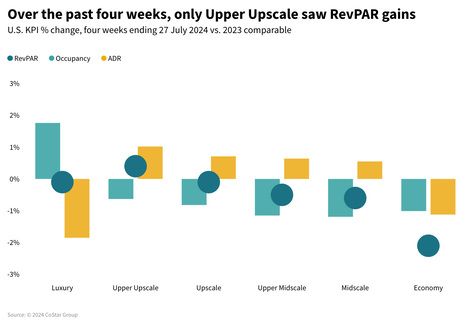
Over the past four weeks, chain scale performance was similar albeit more muted. Upper Upscale was the only chain scale producing positive RevPAR comparisons. The rest of the chains scale saw RevPAR declines ranging from -0.1% to -2.1% in order from Luxury to Economy.
|
STR Weekly Insights: 21-27 July 2024
|
|
STR Weekly Insights: 21-27 July 2024
|
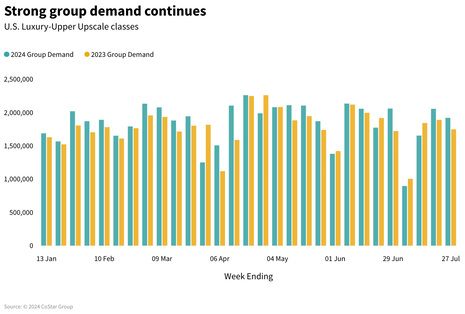
Strong group demand continued
Group demand in Luxury and Upscale hotels has increased in 22 of the past 28 weeks, producing an average increase of 4.4% YoY. This most recent group demand increase of 9.9% came with an ADR gain of 4.9%. Both the Top 25 Markets and all other markets supported this increase with group demand and ADR in the Top 25 Markets up 11.1% and 5.4%, respectively. All other markets posted a group demand gain of 8.7% with ADR up 4.2%. Eight of the Top 25 Markets experienced demand increases of over 20%, including Atlanta, Las Vegas, Los Angeles, Miami, New Orleans, Philadelphia, San Diego and San Francisco.
Transient performance across Luxury and Upper Upscale hotels softened year over year with demand down 1.2% and ADR basically flat at 0.2%. Over 28 weeks this year, transient demand has increased an average of 2.3% with 22 weeks with positive comparisons.
|
STR Weekly Insights: 21-27 July 2024
|
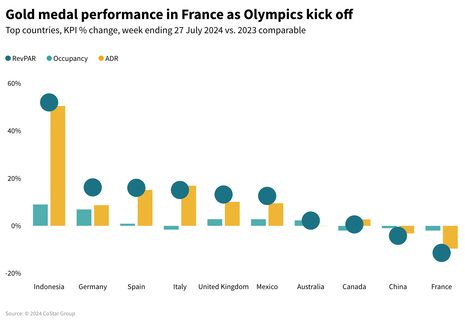
Gold medal performance in France
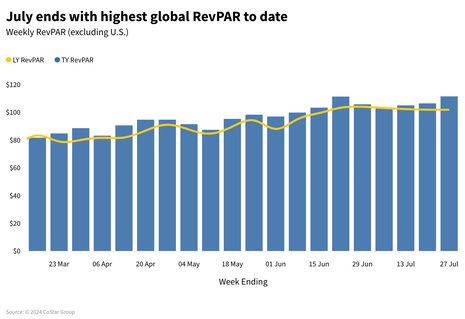
Global RevPAR reached a year-to-date high of US$112, up 9.4% YoY and driven almost exclusively by ADR (+8.6% YoY). Occupancy increased slightly (+0.5 ppts), reaching a 2024 high at 73.7%.
During the week of the Olympics’ opening ceremony and the first full day of the games, France increased RevPAR 52.0% YoY, driven primarily by ADR (+50.7%). In Paris, occupancy for the week decreased (-5.7 ppts YoY), but ADR in the capital surged by 90.8%. This positive impact extended to the surrounding Île-de-France region, which saw an ADR gain of 83.4% YoY. On the Saturday night of the opening ceremony, Paris ADR increased 146% YoY with absolute ADR skyrocketing to US$951, while occupancy equally benefited, rising +15.8 ppts to 87.5%.
A similar pattern was seen in London in 2012 during the first week of the games. There, occupancy fell 11.3 ppts while ADR increased 33.0% YoY. On the night of the opening ceremony in 2012, ADR increased 83% YoY, while occupancy remained almost flat, down 0.3 ppts to 85.0%.
|
STR Weekly Insights: 21-27 July 2024
|
|
STR Weekly Insights: 21-27 July 2024
|
Looking ahead
It would be fun to say the U.S. industry stuck the landing this week with the start of the Olympics, but realistically, it was more of a soft landing with economic pressures impacting the pocketbooks of some travelers, changing travel patterns and competition from other lodging sectors reshaping the industry. August will continue to soften as the school year begins across the U.S. and family travel ends. The healthy group performance seen this summer is a positive indication that September should be strong as fall conferences and events ramp up.
Global performance did stick the landing with Paris earning the gold. Over the next couple weeks, the global hotel industry is expected to remain strong and then slow, similar to the U.S., as schools start back up in September.
|
STR Weekly Insights: 21-27 July 2024
|
*Analysis by Isaac Collazo, Chris Klauda, Will Anns
About CoStar Group, Inc.
CoStar Group (NASDAQ: CSGP) is a leading provider of online real estate marketplaces, information, and analytics in the property markets. Founded in 1987, CoStar Group conducts expansive, ongoing research to produce and maintain the largest and most comprehensive database of real estate information. CoStar is the global leader in commercial real estate information, analytics, and news, enabling clients to analyze, interpret and gain unmatched insight on property values, market conditions and availabilities. Apartments.com is the leading online marketplace for renters seeking great apartment homes, providing property managers and owners a proven platform for marketing their properties. LoopNet is the most heavily trafficked online commercial real estate marketplace with thirteen million average monthly global unique visitors. STR provides premium data benchmarking, analytics, and marketplace insights for the global hospitality industry. Ten-X offers a leading platform for conducting commercial real estate online auctions and negotiated bids. Homes.com is the fastest growing online residential marketplace that connects agents, buyers, and sellers. OnTheMarket is a leading residential property portal in the United Kingdom. BureauxLocaux is one of the largest specialized property portals for buying and leasing commercial real estate in France. Business Immo is France's leading commercial real estate news service. Thomas Daily is Germany's largest online data pool in the real estate industry. Belbex is the premier source of commercial space available to let and for sale in Spain. CoStar Group's websites attracted over 163 million average monthly unique visitors in the third quarter of 2024. Headquartered in Washington, DC, CoStar Group maintains offices throughout the U.S., Europe, Canada, and Asia. From time to time, we plan to utilize our corporate website, CoStarGroup.com, as a channel of distribution for material company information. For more information, visit CoStarGroup.com.
This news release includes "forward-looking statements" including, without limitation, statements regarding CoStar's expectations or beliefs regarding the future. These statements are based upon current beliefs and are subject to many risks and uncertainties that could cause actual results to differ materially from these statements. The following factors, among others, could cause or contribute to such differences: the risk that future media events will not sustain an increase in future occupancy rates. More information about potential factors that could cause results to differ materially from those anticipated in the forward-looking statements include, but are not limited to, those stated in CoStar's filings from time to time with the Securities and Exchange Commission, including in CoStar's Annual Report on Form 10-K for the year ended December 31, 2023 and Forms 10-Q for the quarterly periods ended March 31, 2024, June 30, 2024, and September 30, 2023, each of which is filed with the SEC, including in the "Risk Factors" section of those filings, as well as CoStar's other filings with the SEC available at the SEC's website (www.sec.gov). All forward-looking statements are based on information available to CoStar on the date hereof, and CoStar assumes no obligation to update or revise any forward-looking statements, whether as a result of new information, future events or otherwise.
STR Weekly Insights: 14-20 July 2024
Click here to view the original version of this article.
STR
https://str.com
735 East Main Street
USA - Hendersonville, TN 37075
Phone: (615) 824-8664
Fax: (615) 824-3848
Email: info@str.com
Video: Overview of the U.S. hotel forecast assumptions (Q3 2025)
Video: Overview of the global market forecast assumptions - Q3 2025
U.S. hotel results for week ending 6 September