STR Weekly Insights: 14-20 July 2024
 STR Weekly Insights: 14-20 July 2024
|
 STR Weekly Insights: 14-20 July 2024
|
 STR Weekly Insights: 14-20 July 2024
|
 STR Weekly Insights: 14-20 July 2024
|
 STR Weekly Insights: 14-20 July 2024
|
 STR Weekly Insights: 14-20 July 2024
|
 STR Weekly Insights: 14-20 July 2024
|

Countries/markets mentioned:
- United States: Atlanta, Chicago, Denver, Detroit, Houston, Kansas City, Las Vegas, Minneapolis, New Orleans, Pittsburgh, Salt Lake City
- Global: France (Paris), Indonesia (Jakarta, Kalimantan, Bali), Germany (Berlin)
Highlights
- U.S. weekly occupancy the highest since the pandemic.
- Highest U.S. weekly RevPAR on record
- U.S. weekly room demand fifth highest since 2000, Group contributed
- Tech outage impact felt across airport hotels and select markets
- Euros pushed Berlin ADR to third highest level on record
- Paris ready for the Olympics
Strong U.S. hotel performance even before the weekend’s major tech outage
Performance bounced back during the week ending July 20, 2024, with U.S. revenue per available room (RevPAR) up 11.4% week over week (WoW) and 3.4% year over year (YoY). That growth pushed the metric to the highest level for any week on record ($122.04). However, to temper excitement, RevPAR was 2.2% below 2019 levels when adjusted for inflation.
The tech outage that occurred Friday, 19 July, positively impacted the industry, but performance over the five days before the outage was even stronger (RevPAR: +4.1% YoY).
The industry returned to patterns seen for most of the year with the Top 25 Markets, weekdays, and group driving the strong performance. Chain scale bifurcation also continued with those at the upper end posting better results than those at the bottom. All chain scales, except Economy, saw RevPAR growth. Economy was flat from last year, which was the best YoY result in the segment since the early-April eclipse week.
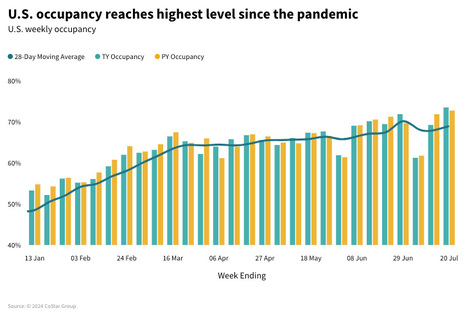
U.S. hotel occupancy reached highest level since the pandemic
U.S. hotel occupancy reached the highest level (73.5%) since the pandemic, increasing 0.7 percentage points (ppts) YoY. The last time occupancy surpassed 73% was in the summer of 2019, and it was this week in 2019 that produced the highest occupancy (77.7%) of that year. The highest weekly occupancy ever posted (79%) was in the week ending 25 July 2015. Like in 2019, 2024’s occupancy peak has likely been attained with next week’s (ending July 27) level expected to drop slightly followed by continued declines as summer comes to an end.
Average daily rate (ADR) rose 2.4%, which was the best gain of the past three weeks. For comparison, in 2019, when occupancy peaked, ADR only increased 0.8%.
Weekends (Friday-Saturday) continued to have the highest occupancy (79.4%) while weekdays (Monday – Thursday) at 73.9% showed the greatest growth. Weekdays produced the strongest RevPAR gain (+4.5%), lifted by ADR (+3.2%) and occupancy (+0.9ppts). Weekend (Friday-Saturday) RevPAR increased 1.9%, also by ADR (+1.2%) and occupancy (+0.6ppts).
|
STR Weekly Insights: 14-20 July 2024
|
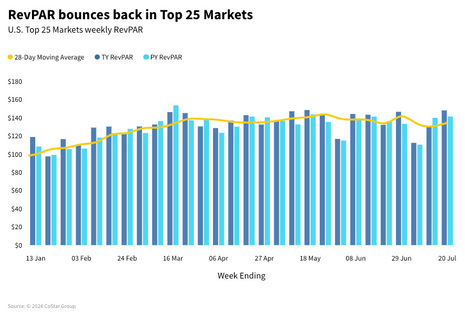
Top 25 Markets continue to drive industry performance
RevPAR across the Top 25 Markets increased 4.8% YoY driven by both occupancy (+2.2ppts) and ADR (+1.8%). Weekday (Monday – Thursday) performance was strongest with RevPAR up 6.0% on occupancy growth (+2.7ppt) slightly stronger than ADR (+2.3%). RevPAR in the rest of the country grew 2.3% with weekdays seeing the strongest performance (+3.5%). Weekends increased only 0.6%.
Houston posted a strong overall week as it recovers from Hurricane Beryl. Las Vegas, Detroit and New Orleans also experienced double-digit RevPAR gains.
|
STR Weekly Insights: 14-20 July 2024
|
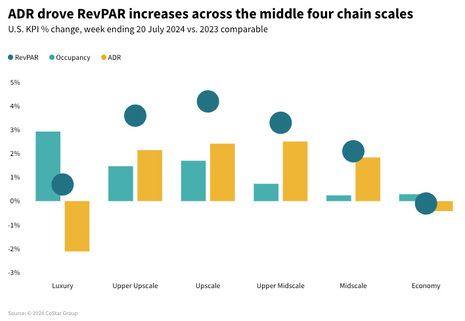
Almost all chain scales elevated by ADR and weekdays
ADR drove RevPAR gains across the middle four chain scales with Upscale posting the largest RevPAR increase (+4.2%) followed by Upper Upscale (+3.7%), Upper Midscale (+3.3%) and Midscale (+2.1%). Luxury saw RevPAR growth (+0.7%) via occupancy.
Weekday RevPAR ranged from +5.3% in Upscale to +0.2% in Luxury with all chain scales seeing growth. Luxury chains increased occupancy (+2.9%), offsetting an ADR decrease (-2.1%). Sunday posted the strongest Luxury chain RevPAR performance (+7.1%) with weekdays and weekends up 2.3%. Economy chain performance was muted with occupancy at +0.3% and ADR at -0.4%. Changes across dayparts were within one percent of each other.
|
STR Weekly Insights: 14-20 July 2024
|
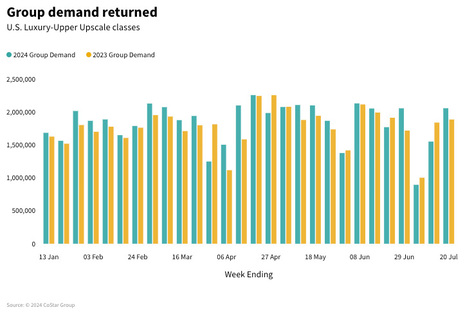
Group demand returned, lifted by the Top 25 Markets
As is typical, group performance in Luxury and Upscale hotels rebounded this week, buoyed by the Top 25 Markets. Group demand increased 9.1% with the Top 25 Markets seeing a 14.5% increase versus 5.3% for the rest of the country. Group ADR increased 5.3% overall with the Top 25 Markets increasing ADR 5.8%. Seventeen of the Top 25 Markets saw group occupancy rise with four markets—Houston, Las Vegas, Minneapolis and New Orleans—experiencing occupancy increases of 10ppts or more.
Transient performance across Luxury and Upper Upscale hotels improved modestly year over year with demand flat and ADR up 1.2%. Transient demand was above 2019 levels by 2.1%, while group demand was still at a deficit (-4.9%).
|
STR Weekly Insights: 14-20 July 2024
|
IT outage impacted airport hotels and several markets
The tech outage drove stronger weekend results in airport hotels. Airport weekend occupancy increased 3.6ppts compared to 0.6ppts for the industry. ADR increased 2.4% vs. 1.2%, resulting in RevPAR up 6.9% vs.1.9% for the industry.
Across the Top 25 Markets, Minneapolis, Atlanta, Denver and Chicago all saw weekend performance at elevated levels relative to the rest of the week. Large hotel markets outside the Top 25 that appeared to see a performance bump were Indianapolis, Kansas City, Pittsburgh and Salt Lake City.
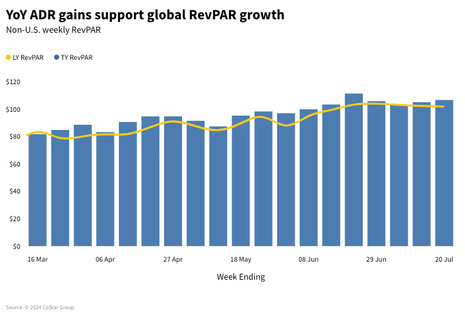
Global RevPAR above US$100 for the sixth consecutive week
Global RevPAR, excluding the U.S., increased 4.7% YoY, driven by ADR (+4.4%) as occupancy remained relatively stable (+0.2ppts) at 73.3%, the highest of the year.
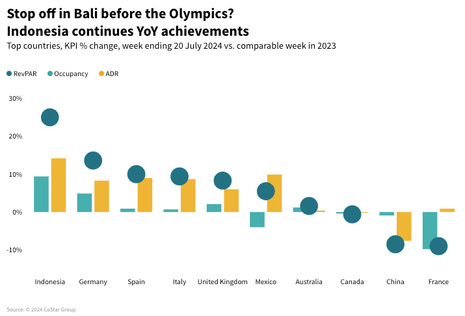
Across the largest countries in terms of supply, Indonesia continued to lead in gains, supported by a mix of occupancy and ADR. Eleven out of its 12 markets saw occupancy increase, led by Jakarta (+11.6 ppts to 75.2%) and Kalimantan (+11.1 ppts to 79.6%). ADR increases were also seen in 10 markets with Bali (+18.9%) and Jakarta (+15.4%) recording the greatest gains.
The final match of the Euros produced the third highest ADR on record for Berlin on Sunday, 14 July, up 198.8% to $382, while occupancy grew 11 ppts to 87.3%. This helped lift the entire country’s results for the whole week, as both occupancy and ADR increased (+3.4ppts and +8.3%, respectively).
In the week leading to the Olympics, France continued to be affected by displacement, with a 9% RevPAR decline caused entirely by declining occupancy (-7.3ppts). Looking forward, Paris occupancy on the books for the Olympic opening ceremony, as of July 22, stood at 90% with demand for the remainder of the games at 83.1%, up +26.8% versus the same period last year.
|
STR Weekly Insights: 14-20 July 2024
|
|
STR Weekly Insights: 14-20 July 2024
|
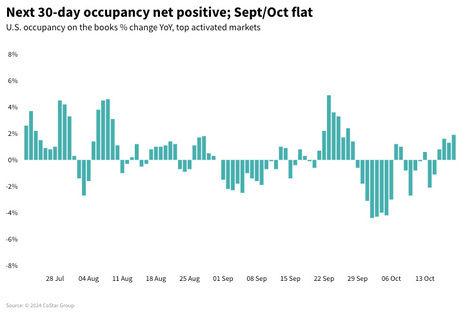
Looking ahead
Based on long-term historical trends, next week’s data (ending 27 July) is expected to show slight softening as the summer travel season begins to wind down. In the first full week of August, one in four K-12 students will be back in class, according to STR's 2024-2025 School Break Report.
One silver lining from the tech outage is the lingering lift for airport hotels and several markets in the next data we process.
Group business is also expected to continue at elevated levels along with weekday travel in the Top 25 Markets.
The remainder of the world will also see slowing occupancy and solid ADR growth. Indonesia’s strong performance is expected to continue along with robust performance in Paris as the Olympic Games begin.
|
STR Weekly Insights: 14-20 July 2024
|
*Analysis by Isaac Collazo, Chris Klauda, Will Anns
About CoStar Group, Inc.
CoStar Group (NASDAQ: CSGP) is a leading provider of online real estate marketplaces, information, and analytics in the property markets. Founded in 1987, CoStar Group conducts expansive, ongoing research to produce and maintain the largest and most comprehensive database of real estate information. CoStar is the global leader in commercial real estate information, analytics, and news, enabling clients to analyze, interpret and gain unmatched insight on property values, market conditions and availabilities. Apartments.com is the leading online marketplace for renters seeking great apartment homes, providing property managers and owners a proven platform for marketing their properties. LoopNet is the most heavily trafficked online commercial real estate marketplace with thirteen million average monthly global unique visitors. STR provides premium data benchmarking, analytics, and marketplace insights for the global hospitality industry. Ten-X offers a leading platform for conducting commercial real estate online auctions and negotiated bids. Homes.com is the fastest growing online residential marketplace that connects agents, buyers, and sellers. OnTheMarket is a leading residential property portal in the United Kingdom. BureauxLocaux is one of the largest specialized property portals for buying and leasing commercial real estate in France. Business Immo is France's leading commercial real estate news service. Thomas Daily is Germany's largest online data pool in the real estate industry. Belbex is the premier source of commercial space available to let and for sale in Spain. CoStar Group's websites attracted over 163 million average monthly unique visitors in the third quarter of 2024. Headquartered in Washington, DC, CoStar Group maintains offices throughout the U.S., Europe, Canada, and Asia. From time to time, we plan to utilize our corporate website, CoStarGroup.com, as a channel of distribution for material company information. For more information, visit CoStarGroup.com.
This news release includes "forward-looking statements" including, without limitation, statements regarding CoStar's expectations or beliefs regarding the future. These statements are based upon current beliefs and are subject to many risks and uncertainties that could cause actual results to differ materially from these statements. The following factors, among others, could cause or contribute to such differences: the risk that future media events will not sustain an increase in future occupancy rates. More information about potential factors that could cause results to differ materially from those anticipated in the forward-looking statements include, but are not limited to, those stated in CoStar's filings from time to time with the Securities and Exchange Commission, including in CoStar's Annual Report on Form 10-K for the year ended December 31, 2023 and Forms 10-Q for the quarterly periods ended March 31, 2024, June 30, 2024, and September 30, 2023, each of which is filed with the SEC, including in the "Risk Factors" section of those filings, as well as CoStar's other filings with the SEC available at the SEC's website (www.sec.gov). All forward-looking statements are based on information available to CoStar on the date hereof, and CoStar assumes no obligation to update or revise any forward-looking statements, whether as a result of new information, future events or otherwise.
STR Weekly Insights: 7-13 July 2024
STR Weekly Insights: 21-27 July 2024
Click here to view the original version of this article.
STR
https://str.com
735 East Main Street
USA - Hendersonville, TN 37075
Phone: (615) 824-8664
Fax: (615) 824-3848
Email: info@str.com
Video: Overview of the U.S. hotel forecast assumptions (Q3 2025)
Video: Overview of the global market forecast assumptions - Q3 2025
U.S. hotel results for week ending 6 September