STR Weekly Insights: 15-21 September 2024
 STR Weekly Insights: 15-21 September 2024
|
 STR Weekly Insights: 15-21 September 2024
|
 STR Weekly Insights: 15-21 September 2024
|
 STR Weekly Insights: 15-21 September 2024
|
 STR Weekly Insights: 15-21 September 2024
|
 STR Weekly Insights: 15-21 September 2024
|
 STR Weekly Insights: 15-21 September 2024
|

Countries/markets mentioned:
- United States: Columbus, Houston, New Orleans, New York City, Oklahoma City, Raleigh/Durham/Chapel Hill, San Francisco
- Global: China (Chengdu, Guangdong), Germany (Berlin, Munich), Mexico (Mexico City)
Highlights
- Solid growth week for U.S. hotels
- Event calendar shifts impacted San Francisco (positive) and New York City (negative)
- Highest Group room demand since 2019
- Holiday calendars impact markets across the globe
Positive performance in one market offsets negative performance in another
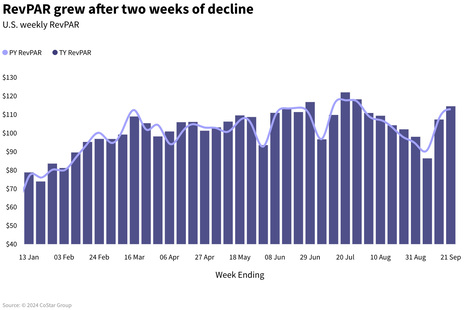
In the week ending 21 September 2024, U.S. hotels saw revenue per available room (RevPAR) rise 2.5% with the bulk of the increase coming from average daily rate (ADR), up 2.0%. More than 60% of the industry’s weekly demand gain came from the Top 25 Markets, where RevPAR increased 3.1% on a slightly higher gain in ADR (+1.9%) than occupancy (+1.2%). RevPAR in all other markets also grew (+2%) via ADR. Industry occupancy increased to 68.9%, the first time above 68% since early-August.
A shift in two major conferences had a significant impact on Top 25 Market performance. San Francisco, which hosted Salesforce’s Dreamforce conference, saw RevPAR rise 71.6%. The conference was a week later this year.
New York City saw RevPAR fall 14.5% due to the shift in the United Nations’ General Assembly “High-level Week”, which is a week later this year. Sunday through Thursday were totally responsible for New York City’s RevPAR decline, down 24.4%, while weekend RevPAR in New York City increased 20.3% as the UN event began to ramp up.
Excluding both San Francisco and New York City, the remaining 23 major markets saw even stronger RevPAR growth (+4.2%). Even the industry as a whole would have seen stronger RevPAR (+2.9%) without those two markets.
Industry room demand increased 0.9% (+253,000 room nights) year over year after falling in the previous two weeks. Weekends (Friday & Saturday) accounted for most of the gain (43%) followed by weekdays (Monday-Wednesday), which made up 39% of the industry’s demand growth.
It is interesting that those two day categories took different paths to demand growth. Weekend demand growth was led by non-Top 25 Markets, which contributed 84% of the gain in room nights. RevPAR in those markets increased 2.6% with occupancy of 73.6%, up 0.9 percentage points (ppts). Oklahoma City, with the Tennessee and Oklahoma football game in Norman, led the nation with weekend RevPAR rising by more than 100%. Other markets with gridiron gains included Columbus and Raleigh/Durham/Chapel Hill. While not contributing much to new demand, Top 25 weekend performance was also good as RevPAR increased 2% with flat occupancy (79.4%).
Weekdays belonged to the Top 25 Markets, which accounted for 93% of growth. Weekday occupancy in the Top 25 hit 77% with RevPAR growing 4.1%. Houston, Orlando, Boston and Los Angeles all saw double-digit RevPAR gains during the weekdays, which also led to double-digit growth for the full week. Overall, 17 of the Top 25 Markets saw weekly RevPAR gains.
|
STR Weekly Insights: 15-21 September 2024
|
|
STR Weekly Insights: 15-21 September 2024
|
ADR was also the primary driver across the chain scales
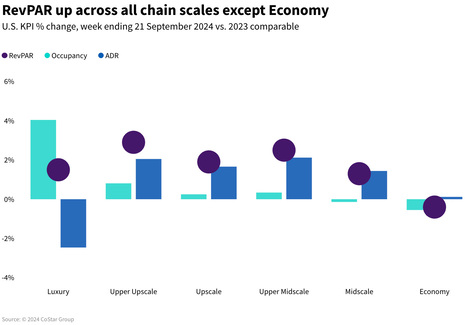
Nearly all chain scales saw RevPAR gains except for Economy, which fell 0.4%--its lowest decrease of the past four weeks. ADR drove RevPAR gains in four chain scales (Upper Upscale, Upscale, Upper Midscale and Midscale), with RevPAR ranging from +2.9% in Upper Upscale to +1.3% in Midscale. Luxury increased RevPAR (+1.5%) due to occupancy gains (+2.9ppts) while ADR declined 2.5%.
Not surprisingly, Upper Upscale saw the largest weekday RevPAR increase (+4.6%) with occupancy at 81.8%. Upscale weekday occupancy was also strong (81%) with RevPAR advancing 2.5%. Upscale chains also did well on the weekend with an occupancy level just a bit higher than on weekdays (81.1%). However, in terms of RevPAR, weekday RevPAR growth was highest in Luxury (+10.5%) because of ADR (+7.5%).
|
STR Weekly Insights: 15-21 September 2024
|
Record-high Group demand
Group demand for Luxury and Upscale hotels increased 3.7% YoY, reaching the highest level (2.4 million rooms) since Fall 2019. Group ADR increased 1.8%.
Some of this growth was due to the conference calendar shift in San Francisco with Group occupancy up 14.8ppts. That was partially muted by the shift in New York City where Group occupancy declined 5.1ppts. The data we process next week will provide a clearer view of Group performance as we move into peak meetings and events season. Weekly Transient demand was up (+1.5%) along with ADR (+1.1%). The Top 25 Markets drove this positive Transient demand while the rest of the country remained flat year over year.
|
STR Weekly Insights: 15-21 September 2024
|
Holiday calendar shifts in Mexico, Germany and China impacted global performance
Global RevPAR rose 5.9%, driven entirely by ADR (+8.6%). While occupancy declined (-1.8ppts), it remained strong at 70.5%. RevPAR in the top 10 largest countries, based on supply, advanced much slower with RevPAR up 2% due to a sharper occupancy decline. The largest decline was in China, where RevPAR fell 15.6%. Performance in China was impacted by the shift in the Mid-Autumn Festival via a 9.7ppts occupancy fall.
Shifting festival dates also caused a drop in Germany, where RevPAR fell 9.3%. The shift in Oktoberfest, which began on 21 September 21 this year compared to the earlier start of 16 September last year led to a 9% ADR decline. Key markets such as Munich and Berlin were impacted the most, with ADR falling by 32.1% and 14.8% respectively.
Mexico continued significant ADR growth (+25%), resulting in a 23.2% RevPAR gain. Most markets posted RevPAR gains, with the largest in Mexico City (+51%), the result of the numerous celebrations for the Grito de Dolores.
|
STR Weekly Insights: 15-21 September 2024
|
|
STR Weekly Insights: 15-21 September 2024
|
Looking ahead
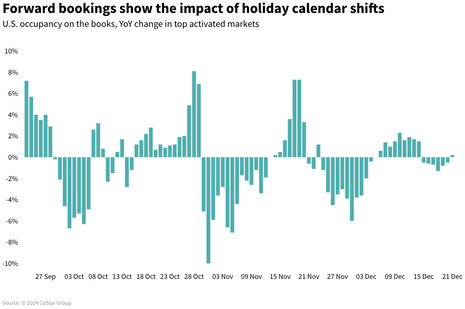
U.S. hotels performed as expected with a lift from the Dreamforce calendar shift in San Francisco. As shown in our Forward STAR data, the next batch of data is expected to be even stronger with a significant lift from New York City due to the U.N. General Assembly meeting. We expect the overall month of September to be weak as it has one less weekend compared to last year.
Early-October will also be soft as the Rosh Hashana observance begins on the evening of Wednesday, 2 October, impacting business and group travel. Global performance is expected to remain strong at a more modest pace as it returns to normal with the impact of shifting holiday calendars continuing to produce week-over-week volatility.
|
STR Weekly Insights: 15-21 September 2024
|
*Analysis by Isaac Collazo, Chris Klauda, Will Anns.
About CoStar Group, Inc.
CoStar Group (NASDAQ: CSGP) is a leading provider of online real estate marketplaces, information, and analytics in the property markets. Founded in 1987, CoStar Group conducts expansive, ongoing research to produce and maintain the largest and most comprehensive database of real estate information. CoStar is the global leader in commercial real estate information, analytics, and news, enabling clients to analyze, interpret and gain unmatched insight on property values, market conditions and availabilities. Apartments.com is the leading online marketplace for renters seeking great apartment homes, providing property managers and owners a proven platform for marketing their properties. LoopNet is the most heavily trafficked online commercial real estate marketplace with thirteen million average monthly global unique visitors. STR provides premium data benchmarking, analytics, and marketplace insights for the global hospitality industry. Ten-X offers a leading platform for conducting commercial real estate online auctions and negotiated bids. Homes.com is the fastest growing online residential marketplace that connects agents, buyers, and sellers. OnTheMarket is a leading residential property portal in the United Kingdom. BureauxLocaux is one of the largest specialized property portals for buying and leasing commercial real estate in France. Business Immo is France's leading commercial real estate news service. Thomas Daily is Germany's largest online data pool in the real estate industry. Belbex is the premier source of commercial space available to let and for sale in Spain. CoStar Group's websites attracted over 163 million average monthly unique visitors in the third quarter of 2024. Headquartered in Washington, DC, CoStar Group maintains offices throughout the U.S., Europe, Canada, and Asia. From time to time, we plan to utilize our corporate website, CoStarGroup.com, as a channel of distribution for material company information. For more information, visit CoStarGroup.com.
This news release includes "forward-looking statements" including, without limitation, statements regarding CoStar's expectations or beliefs regarding the future. These statements are based upon current beliefs and are subject to many risks and uncertainties that could cause actual results to differ materially from these statements. The following factors, among others, could cause or contribute to such differences: the risk that future media events will not sustain an increase in future occupancy rates. More information about potential factors that could cause results to differ materially from those anticipated in the forward-looking statements include, but are not limited to, those stated in CoStar's filings from time to time with the Securities and Exchange Commission, including in CoStar's Annual Report on Form 10-K for the year ended December 31, 2023 and Forms 10-Q for the quarterly periods ended March 31, 2024, June 30, 2024, and September 30, 2023, each of which is filed with the SEC, including in the "Risk Factors" section of those filings, as well as CoStar's other filings with the SEC available at the SEC's website (www.sec.gov). All forward-looking statements are based on information available to CoStar on the date hereof, and CoStar assumes no obligation to update or revise any forward-looking statements, whether as a result of new information, future events or otherwise.
STR Weekly Insights: 22-28 September 2024
Click here to view the original version of this article.
STR
https://str.com
735 East Main Street
USA - Hendersonville, TN 37075
Phone: (615) 824-8664
Fax: (615) 824-3848
Email: info@str.com
U.S. hotel performance for June 2025
Hotel pipeline activity increased globally, except in Middle East and Africa
U.S. hotel results for week ending 12 July